
A 5-Step Framework for a Successful Member Data Project
Working on a member data analysis project for your association? This useful framework will guide your efforts.
Only 20% of analytics projects will ever actually generate business outcomes.
Ouch. That’s why creating a robust plan for your association’s data projects is so important. If you know me, you know I’m a complete data nerd. But you don’t have to be one to use your data effectively. Taking just a few steps ahead of time can ensure your member data projects remain on track and deliver valuable results.
But building a data-driven culture at your association starts with one project at a time.
“What ends up happening with data projects is that you don’t have a shortage of ideas, outcomes, or data. You need to start with the right idea and make sure you have a core purpose of what you’re trying to accomplish ahead of time.”
– Jeff Horne, CEO of Wicket
Today, I’m diving into the steps to create a successful member data project and how you can re-think the relationship between your data and business outcomes so that every project delivers business results.
Did you miss the first two sessions in our member data series? No worries, you can read the rest of this blog post for a recap, or watch the on-demand session here.
Check out the three webinars in the series, featuring panelists from Wicket, CSAE, and Higher Logic.
5 STEPS TO A SUCCESSFUL MEMBER DATA PROJECT
Before you start, be sure you have clearly defined what it is you’re trying to achieve, why you’re trying to achieve it, and what data you need to get there.
I use Wicket’s Member Data Project Framework:
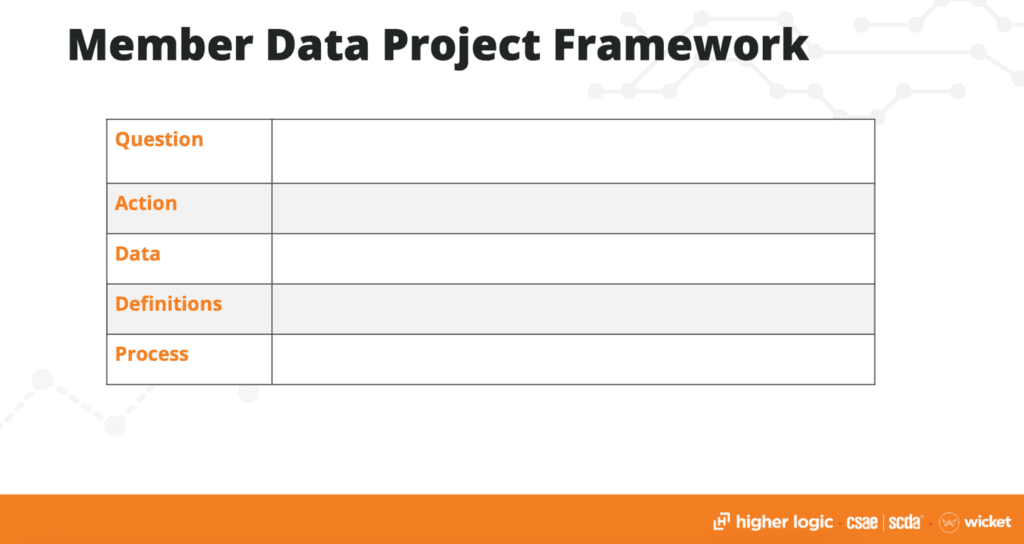
Understanding each piece of their framework — question, action, data, definitions, and process — ahead of any actual work is what’s going to set your team up for success.
Step #1: Ask the Right Questions
You know what you’re trying to achieve, but if you’re not asking the right questions, then you won’t get the right answers. It sounds obvious, but in practice, it can be easy to get distracted by vanity metrics — surface-level metrics that look nice when they go up and to the right, but don’t actually impact your association.
“At first glance, it seems like this useful metric, and plenty of people go down a path of trying to get it. But this type of metric runs the risk of putting in all the work to build a visualization that never gets any traction.”
– Nicole Covello, Data Analyst at Wicket
Let’s take a common challenge for associations as an example: lapsed members. It can be tempting to want to ask, “How can we improve retention this quarter?” but that won’t help you solve the problem of lapsed members. Improving retention may get you fewer lapsed members, but you still have the lapsed members to deal with.
Instead, ask, “How many lapsed members do we have this month, and how does that compare to past averages?” because that will tell you whether or not you need to put resources toward addressing lapsed members in the first place. And if you decide you do, looking at those same data points going back further to find patterns may help you figure out why they lapsed in the first place which can help you with messaging and with avoiding the lapses in the future.
Step #2: Know What Action to Take Based on the Results
Whatever question you ask needs to have an action behind it. As soon as you have the right question, what are you going to do with the answer? How often do you need to revisit it and how? There are a series of questions to ask yourself to define the actions you need to take.
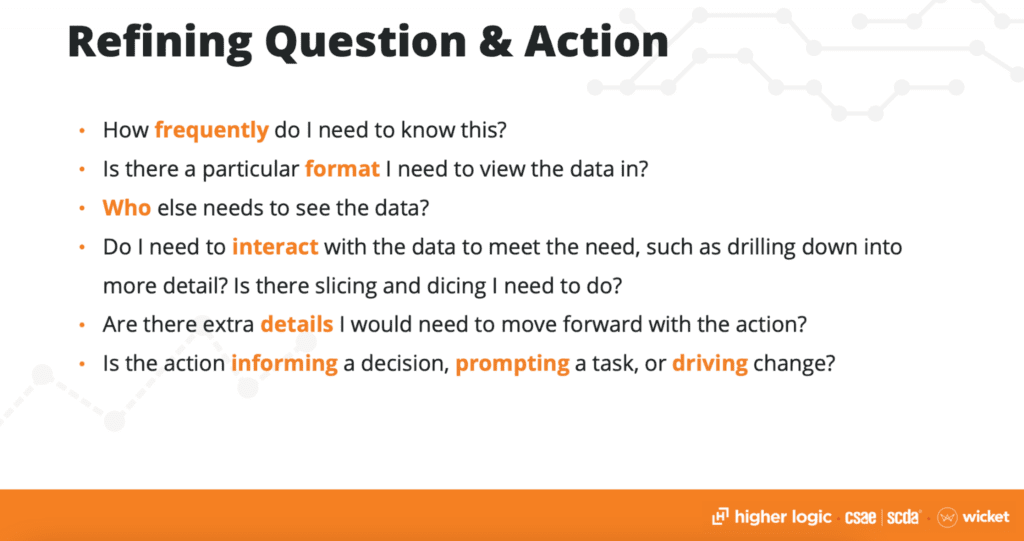
Step #3: Find the Right Data
Once you have your question, and what you’ll do with it once you have an answer, it’s time to find your data.
In this lapsed member example, you’ll want to start with your membership history, including start and end dates, for all members. You want to find out whether or not lapsed membership is a common pattern, and if so, what factors play into that pattern. For example, are there leading indicators of churn you can look at, like a lack of engagement with email?
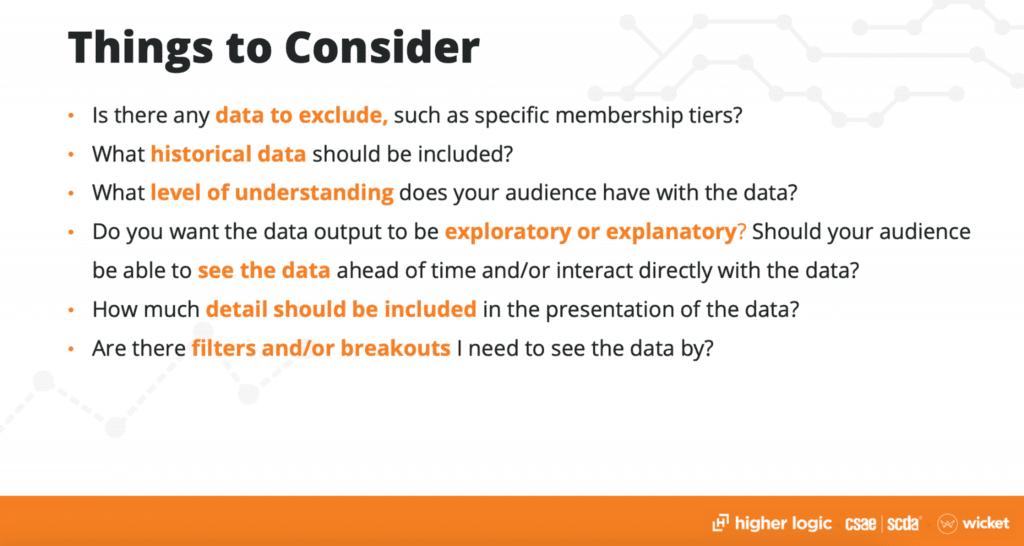
Your data list will depend on your association, but you’ll also need to understand which pieces of the data matter, and which don’t. How much detail do you need? What sources of data should you evaluate to answer this question? Is there any data that doesn’t matter?
“You want to think through who will be using this data and what information they need to have. You may need extra details to facilitate a level of understanding, or filter options out so that it’s easier to make decisions. You need to bring something that people can walk through with you and come to decisions with you, or showcase a particular piece of data in a way that makes sense to your end user.”
– Nicole Covello, Data Analyst at Wicket
You want to refine your data set as much as possible. With lapsed members, rather than look at every single member over time, filter out lapsed members who retired or changed careers, since that’s not something you’ll be able to take action on. Similarly, if your association is more than ten years old, decide your time horizon and if you want to focus on a certain time period.
Step #4: Create a Data Dictionary for the Project
This next step is one that many people skip, but it is critical. Many efforts will fail on an organizational level without it. You must build a data dictionary to get everyone on the same page about the exact definition of the metric you’re measuring.
“Lapsed members,” for example, could mean someone who was dropped for non-renewal three months ago or three years ago. You need that defined for your organization. It’s important that all stakeholders agree on the definition and that everyone else understands it. Otherwise, you could spend valuable time on a campaign to get lapsed members from the last eighteen months, only to find the stakeholders only cared about the last six.
Your dictionary can be as simple as a spreadsheet with a term and a quick definition. Here’s an example:
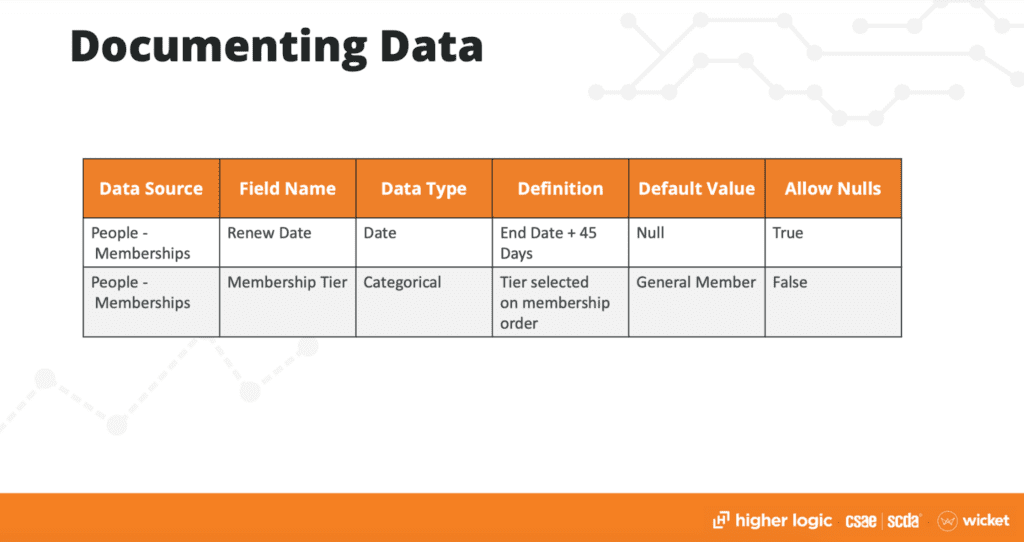
You want a high-level definition that anyone can understand, as well as a technical definition for other team members, like whether you’ll allow null values (a blank cell). This facilitates understanding of the data to make that action happen and get that question answered.
You may already have something like this at your association, but either way, you’ll need to come together as a team to make sure the definition is super clear.
Step #5: Build a Process Around It
Finally, very few data projects are one-and-done. It’s likely you’ll need this information at regular intervals in the future, especially if you decide to put resources toward solving a problem or moving a metric in a specific direction over time.
This means you need to put a process around the tools you use and the data you’re providing. It can be helpful to have a visualization around it so the rest of your team can understand and pivot as needed.
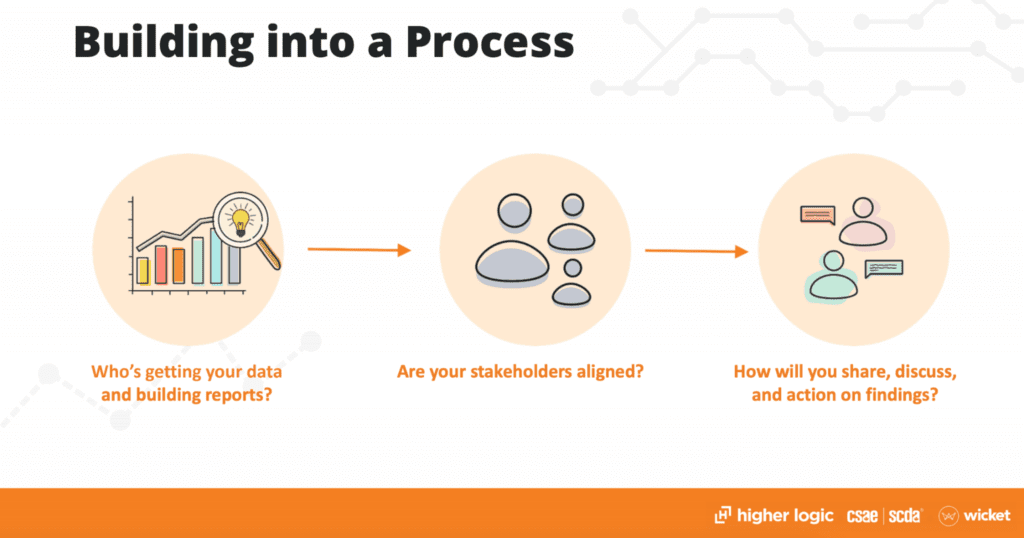
The action should be a specific task that’s part of someone’s workflow, and works with their existing processes. For example, you may already have a monthly meeting or a marketing team member responsible for retention-based emails. You can build that monthly meeting into the process to continually refine how you act on the data.
Otherwise, you’re just asking for a response like, “That’s nice.”
“Stakeholder alignment is so important. One of the things I’ve found is that data can help us identify a gap or a problem, and one of the quickest ways to get buy-in at the executive level is to use a repeatable toolset to identify how to cover that gap, and showing how to solve that problem.”
– Josh Slyman, Sr. Consultant, Strategic Services at Higher Logic
Understand who is getting your data and building reports, align with stakeholders, and determine how to share, discuss, and take action on any findings you have. Context is critical — it’s one thing to hear about open rates and click-through rates in emails, but another to understand how that relates to your lapsed member issue. Making sure your data visualizations focus on action, rather than visualization for visualization’s sake, is a good start.
“We share the aggregate report to the leadership team so they have an overview and can see the bigger picture. And then we share detailed information and historical data with individual team members who can understand how that relates to their specific role at CSAE and take action from there.”
– Vasan Selliah, Member Insight and Engagement Manager, CSAE
Take Action on Your Member Data
To finish up with our lapsed member example, here’s what Wicket’s entire framework looks like all together.
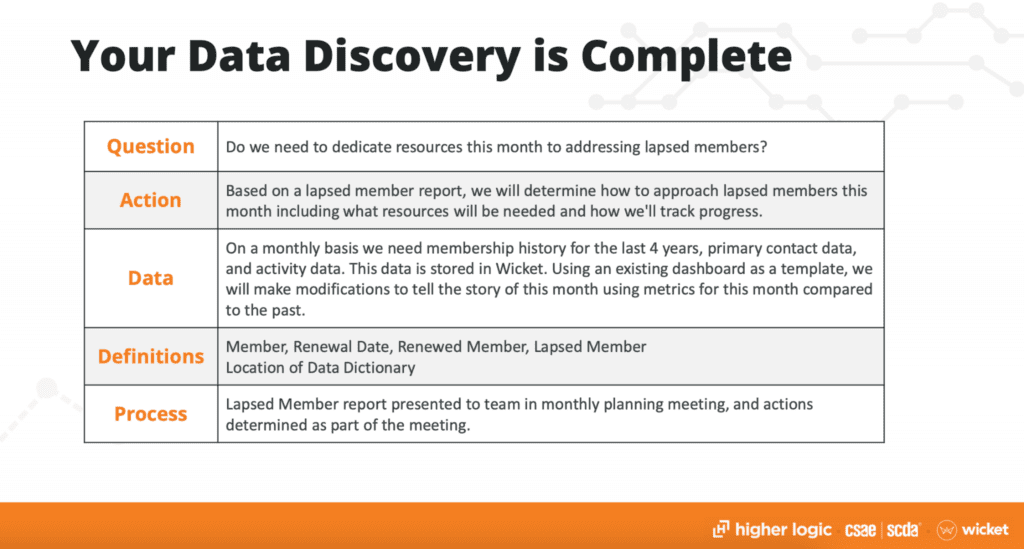
Taking the time to fill this out at the beginning of each project ensures that you’ll know what you’re doing as a team and why it’s important.
That doesn’t mean you should fill it out like a homework assignment and never look at it again. The point of the framework and these five steps is to keep your project on track and successful, and you should add or change elements based on your association and what you need to build a sustainable process as you move forward.
Once the framework is filled out, the real work begins. When you’re ready to dive in, follow these steps:
- Drive the goals. Identify the organizational goals, desired outcomes, and member value this initiative will support.
- Know the terrain. Understand the data and metrics needed to capture the current state and highlight your success.
- Map the journey. Capture the calls-to-action, the cadence, and the content needed to drive a successful effort.
- Explore the sights. Look for opportunities to expand your understanding, serve the members’ needs, and identify potential members of value.
- Best your score. Iterate, innovate, renovate, and build another one.
Want to learn more? Watch the latest webinar on member data.


