
A 5-Step Framework for Successful Member Data Projects

You probably know that being data driven and analyzing your member data is important, but do you know how to ensure effective outcomes? 85% of data analysis projects fail due to things like unclear objectives, poor data quality, and inadequate implementation.
Big yikes.
The good news is, you don’t have to be a data expert to analyze and use your data effectively. But you SHOULD take the time to create a plan for your association’s data projects to ensure they stay on track and deliver valuable results. Below, we’ve outlined a 5-step framework you can use to help you plan successful member data projects.
Before You Start Your Member Data Project
Before you start, be sure you have clearly defined what it is you’re trying to achieve, why you’re trying to achieve it, and what data you need to get there.
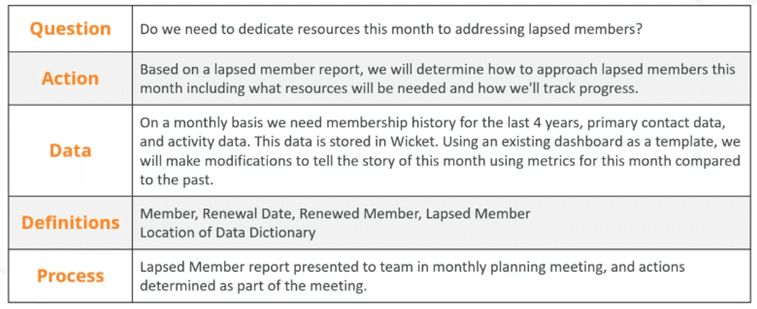
One example is Wicket’s Member Data Project Framework:
- Question – what question are you trying to answer with the data?
- Action – what action will the data help you take?
- Data – what data do you have (or do you need) that would help you answer this question and take action? And is that data something you can repeatedly pull and refer to?
- Definitions – what are the terms you’re using as part of this project? Define them and make sure everyone is on the same page.
- Process – outline how you’re getting the data and how it will be used.
Understanding each piece of this framework — question, action, data, definitions, and process — ahead of any actual work sets your team up for success.
Here’s an example of a the discovery phase of a “Data Project Framework”:
From here, you can dive deeper into planning each component.
Step #1: Ask the Right Question
If you’re not asking the right questions then you won’t get the right answers. It sounds obvious, but in practice, it’s easy to get distracted by by vanity metrics — surface-level metrics that look nice but don’t actually give you enough information to work with and drive positive impact for your association.
Let’s take a common challenge for associations as an example: lapsed members.
It can be tempting to ask, “How can we improve retention this quarter?” but that’s too broad a question. It would likely take multiple data projects to dig into that – exploring trends in your member lapse numbers, measuring the effectiveness of your membership renewal campaigns, and tracking member engagement over time (since engagement is a major indicator of whether someone will stay a member). It’s a good starting point, but it can be helpful to focus in further.
So let’s pick ONE of those areas and instead ask: “How many lapsed members do we have this month, and how does that compare to past averages?”
That will tell you whether or not you need to put resources toward addressing lapsed members in the first place. You’ll also be able to look at those same data points going back further to find patterns that may help you figure out why people lapse in the first place which can help you with messaging to avoid members lapsing in the future.

Step #2: Know What Action to Take Based on the Results
Whatever question you ask needs to have an action behind it. You’re not pulling data just for the sake of it – you’re analyzing your data to help you improve. So as soon as you have the right question, ask yourself: what am I going to DO with the answer and the data? Actions should be useful and repeatable – you don’t do something that you won’t be able to replicate.
Based on what you want to DO, ask yourself:
- Is the action informing a decision, prompting a task, or driving a change?
- How often do you need to revisit the data?
- Is there a particular format I need to view the data?
- Who else needs to see the data?
- Do I need to interact with the data to meet the need? (such as drilling down into more detail? Is there slicing and dicing to do?
- Are there extra details I would need to move forward with the action?
Step #3: Find the Right Data
Knowing your specific question, and what action you want to take once you have your answer, informs what data you’ll need.
What you’re going to DO with the data will likely dictate what format you need it in and what details you’ll need to be able to follow through on your action. Your data list will depend on your association, but you’ll also need to understand which pieces of the data matter, and which don’t. How much detail do you need? What sources of data should you evaluate to answer this question?
Based on what you’re trying to find out and do, ask yourself:
- What data points will I need to answer the question and where can I get that data?
- Are there filters and/or breakouts you need to see the data by?
- What historical data should be included (and how far back)?
- What level of understanding does your audience have with the data?
- Do you want the data output to be exploratory (i.e. it will help people come to a decision WITH you) or explanatory (i.e. you’re using the data to support a point you’re making)
- Should your audience be able to see the data ahead of time and/or interact with directly with the data?
- How much detail should be included in the presentation of the data?
Continuing the lapsed member example…
- To answer the question, “How many lapsed members do we have this month? And how does that compare past averages?” You would probably need:
- Membership history, at least several months back (so you can look for patterns)
- This would include start and end dates for all members
- If you choose to take an action (e.g. reach out to lapsed members with a win-back campaign), the data you would need to follow through would probably include:
- Contact information for all members
- Activity data – education, events, email opens – so you can see what your leading indicators of churn look like (e.g. lack of engagement with email)
You’ll also want to refine your data set as much as possible. With lapsed members you could, for example, filter out lapsed members who retired or changed careers, since you won’t be able to win those members back (though with retired members you might consider moving them into a planned giving communication track). Similarly, if your association is more than ten years old, you may not want to pull your ENTIRE membership history, because that would be too much data. Decide the time period that would be most helpful for your evaluation.
Step #4: Create a Data Dictionary for the Project
One step that many people skip, but that’s critical for success, is defining your terms and creating a “data dictionary”. Many efforts fail on an organizational level without this. All your stakeholders in the project need to be on the same page about the exact definitions of the metrics you’re measuring.
“Lapsed members,” for example, could mean someone who didn’t renew three months ago or three years ago. “Active members” could mean someone who has an active membership, or someone who’s showing signs of actively using their membership (like high email and community engagement). You need to define your terms at an organizational level, with everyone agreeing on and understanding what you mean when you use certain words. Otherwise, you could spend valuable time on a campaign to get lapsed members from the last eighteen months, only to find that some stakeholders only cared about the last six.
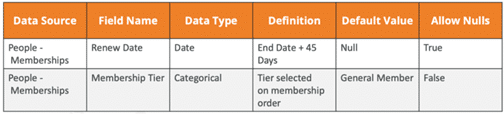
Think about the following elements when compiling your data dictionary:
- Data source (i.e. where the data lives; e.g. your AMS, your marketing automation platform, your online community)
- Field name (i.e. what field you’re pulling the data from; e.g. membership expiration date, community logins)
- Data type (e.g. date, number, category)
- Definition (i.e. a high-level definition that anyone can understand, as well as a technical definition)
- Default Value (e.g. is the field blank if it’s not filled in, or does it default to something?)
- Allow Nulls (i.e. will null values mess up your calculations or can they be included?)
Creating a data dictionary can be as simple as a spreadsheet with a term and a quick definition. Here’s an example:

Step #5: Build a Process Around It
Most data projects are meant to be ongoing – used at regular intervals in the future to help solve a problem or improve performance over time. Thus, it’s important to document your process so you can replicate and refine it.
When doing this, it can be helpful to consider the ways you can tie your data project to existing workflows and staff tasks. Using the lapsed member example again, you may be able to align reporting frequency to a monthly meeting about membership numbers you already have. And maybe your data would be helpful to a marketing team member who’s already responsible for retention-based emails.
As you define your process, you should outline things like:
- Who is building the reports and pulling the data?
- Where is the data going/being used? How can we fit this data into the day-to-day?
- How frequently do we need to know this? What schedule are we pulling the data?
- Is there a particular format we need to review or use the data? Does it need to be in a format we can interact with? (such as drilling down into more detail).
- Are there extra details we would need to move forward with the action this data is influencing?
- Who are the stakeholders who will need to see the data or weigh in and are your stakeholders aligned?
- How will we share, discuss, and take action on findings?
Who is going to interact with your data will also determine how you present and share your findings. For example, the format you provide data to your executive director or the Board would be quite different from what you might look at with a membership or marketing team meeting. Context is also critical — it’s one thing to hear about email open and click rates, and another to understand how that relates to your lapsed member issue. Making sure your data visualizations focus on action, rather than visualization for visualization’s sake, is a good start.
Take Action on Your Member Data
Bringing everything full circle, your whole data framework is designed to help you take action on your member data. So, to finish up with our lapsed member example, here’s what the entire data framework looks like all together.
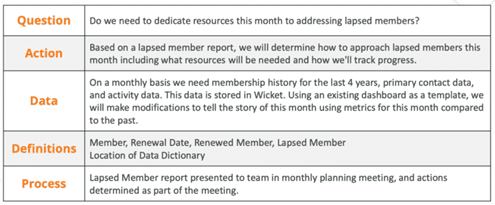
Taking the time to explore these areas at the beginning of each project ensures that the whole team is on the same page. You know why you’re pulling the data, how you’re going to act on it, and why it’s important.
That doesn’t mean you should fill it out like a homework assignment and never look at it again. The point of the data framework and these five steps is to keep your project on track and successful, and you should add or change elements based on your association and what you need to build a sustainable process as you move forward.
Once you’ve had team discussions and this framework is filled out, you’re ready to dive in. Explore next steps in our blog, Turn Your Member Data Into Action!
This blog post was originally published in 2021. It has since been updated for accuracy and relevancy.

